



.png)

Most operators know their booking numbers. Fewer know why those numbers look the way they do. Bookings are down this month. Is it because fewer travelers saw your listing, or because they saw it and didn't book? Those are two different problems, with two different fixes.
The Performance section in the Supplier Portal has grown this fall to help you tell them apart. More context, across your whole business, in one place.
What you can see, and at which level
Performance works on two levels.
At business level, you get the picture of your whole business: revenue, bookings, visitors, conversion rate, average rating, source markets, and booking window, across every product you sell. Trends go back several years (until 2020), so you can compare this season with the last one or see how your business has changed since you started selling on GetYourGuide.
At product level, you get the full path a traveler takes to book with you: impressions, click-through rate, page visits, conversion rate, and bookings. This is where you find out what's working on a specific listing and what isn't.
Both levels have year-on-year comparison built in, and you can change the date range on any chart.
Your whole business, not just one product at a time
Until now, Performance showed you one product at a time. To see how your business was doing overall, you clicked through every activity and added it up yourself.
That's changed. The account view rolls everything up. Total revenue and bookings, your average rating across products, and two things you couldn't easily see before:
Source markets show you where your travelers come from. If 40% of your bookings are from Spain and your product is only offered in English, that's a language option you should probably create. If a market is growing fast, it might be worth opening more availability for its peak travel dates.
.png)
Booking window shows how far in advance travelers book you. If most bookings land in the last few days before the activity, you know how much of your calendar is still likely to fill and when an offer might pull bookings forward.
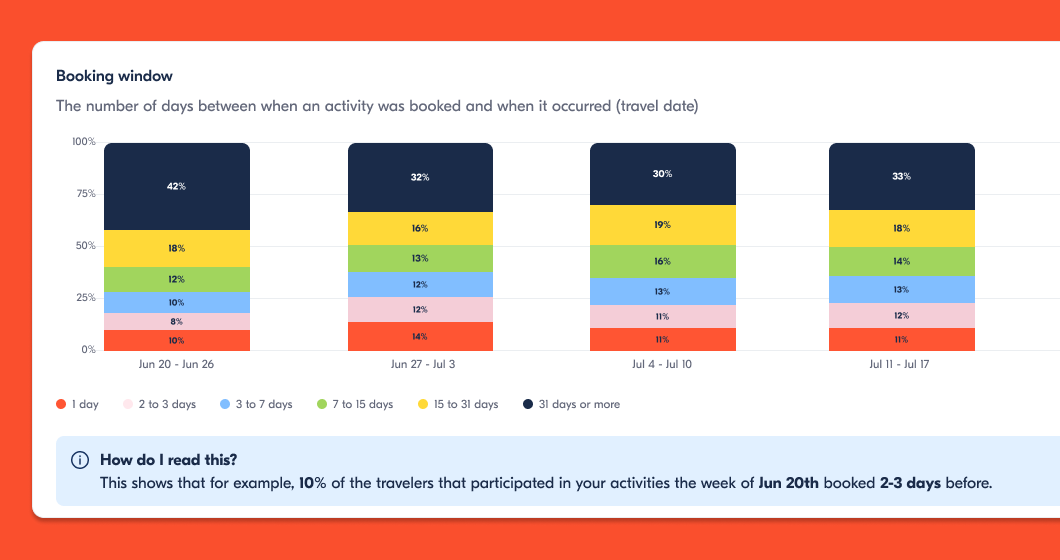
Use it for monthly check-ins on the business, planning new language options and availability by market, and spotting which products are pulling the average up or down.
Open your Performance dashboard→
See where travelers drop off
New metrics are now live: impressions, click-through rate, and page visits.
.png)
Impressions are how many travelers saw your listing in search results. Click-through rate is how many of them clicked. Page visits is how many landed on your activity page. Add your bookings and conversion rate, and you have the full path a traveler takes: Impressions → Page visits → Bookings.
Now the diagnosis gets easier. If you're getting strong impressions but few page visits, your title or main photo might not be compelling enough to earn the click. If page visits are high but bookings are low, something on the activity page itself is holding travelers back: price, description, photos, or reviews. If you get low impressions overall, travelers aren’t finding you in search, which usually points to availability, categories, or how your listing is set up.
You still decide what to change. But you start at the right place, instead of changing three things at once and hoping one of them works.
Use it for diagnosing a product that’s underperforming and checking whether a change you made (new photo, new price) moved the step you were aiming at.
Know if a slow month is normal or a signal
Every business has quiet months. The hard part is knowing whether this one is normal for you or something to look into. Without last year’s numbers next to this year’s, you’re guessing.
The year-on-year toggle puts them side by side, across all your key metrics, at the account and product level. A quiet October that matches last October? Seasonality, leave it. A quiet October that’s 20% below last year? Worth a closer look, and now you know where: check impressions and page visits to see which step dropped.
Use it for separating seasonality from a real decline and deciding whether to hold steady, run a targeted offer, or adjust availability.
We already found the opportunity for you
Below your performance table, you will see recommended actions. They’re specific opportunities we’ve spotted in your booking data.
.png)
Here's a concrete example of how it works. Say 68% of your bookings come in within 7 days of the activity date. The portal surfaces a pre-built advance booking offer designed to shift that pattern and fill your calendar earlier. The offer is already set up. You review it, adjust it if you want, and launch it in a few seconds. Or dismiss it if it doesn’t fit your plans.
Every recommendation tells you why we’re suggesting it, with your own numbers, not just what to do. Recommendations appear for established activities once there’s enough booking history to spot a pattern, and they update as soon as your patterns change, so check back regularly.
Check your recommended actions →
Where to start
The quickest way to get value from the new Performance:
- Go to Performance in the Supplier Portal.
- Open the business view. Check revenue, bookings, and rating, then look at your source markets and booking window.
- Switch on year-on-year comparison. Anything more than a small dip from last year is worth a closer look.
- Click into that product and look at impressions, page visits, and bookings side by side. Find the step where travelers drop off.
- Scroll down to recommended actions and review what's flagged for your account.
.png)