
As a GetYourGuide supply partner, you work tirelessly to create amazing experiences for travelers from around the world.
But having great products is just a start. To maximize growth, you need deep insights into your business performance that allow you to make smart, data-driven decisions. That's where GetYourGuide's new Analytics dashboard comes in.
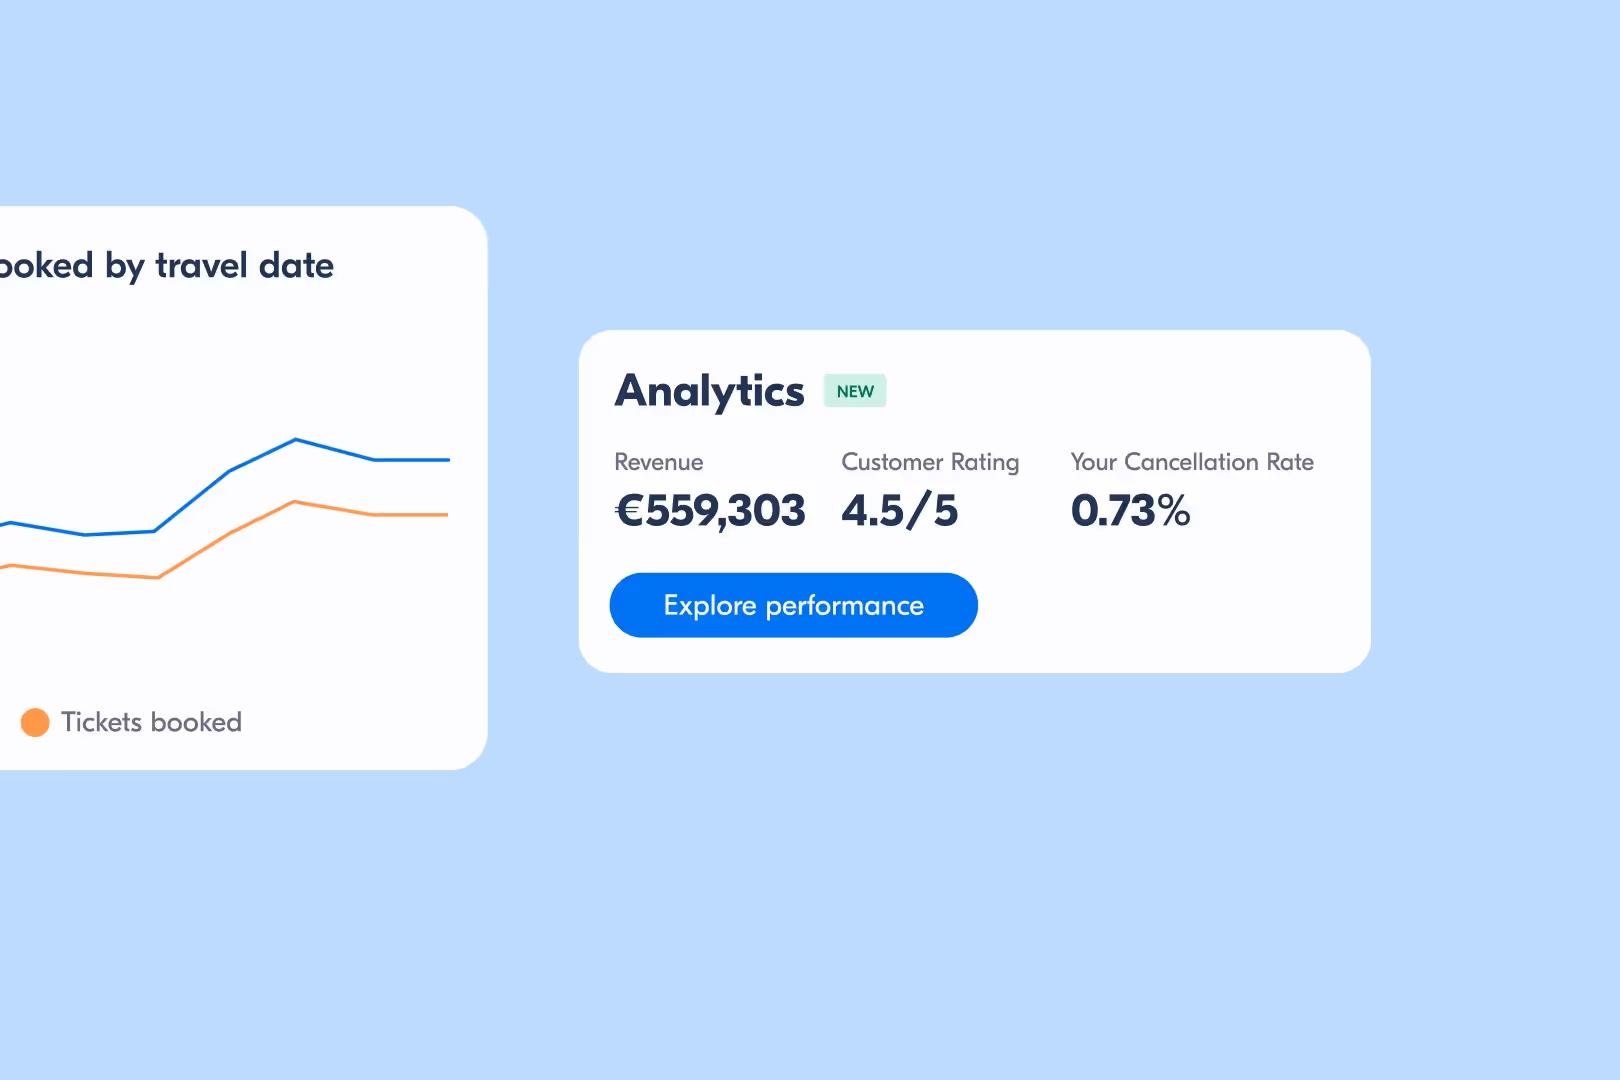
Key metrics in one place
Analytics puts all your key metrics at your fingertips, giving you unprecedented transparency into how your products are performing. You can easily track revenue, bookings, conversion rates, customer ratings, and more—all in one convenient place.
But Analytics isn't just about numbers on a screen. It's about turning those numbers into actions that help you optimize your strategy and drive growth.
Here are just a few ways this game-changing dashboard can supercharge your GetYourGuide business.
Visualize trends and spot patterns
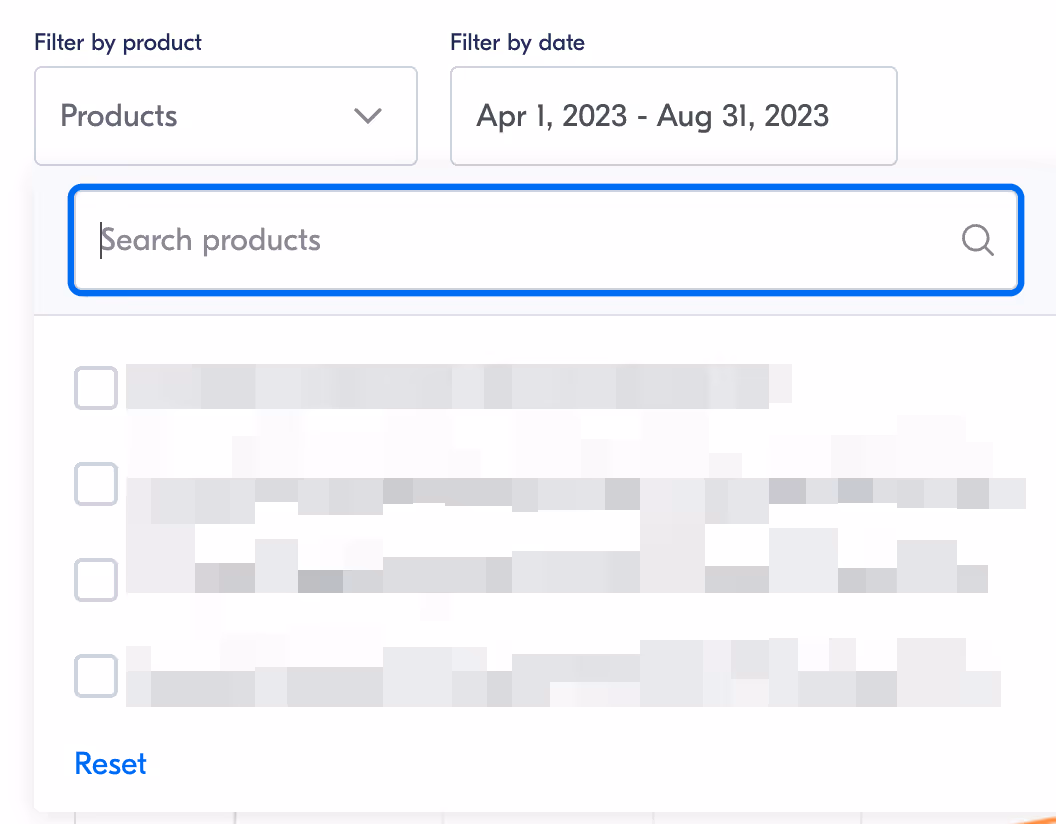
With Analytics, gone are the days of manually pulling reports and sifting through spreadsheets. The moment you log in, you’ll see an intuitive dashboard that allows you to analyze performance trends over any time period with just a few clicks.
Let’s say you want to understand how your revenue has ebbed and flowed over the past year. Select the appropriate date range, and Analytics will instantly chart your revenue numbers in a clean, easy-to-interpret graph.
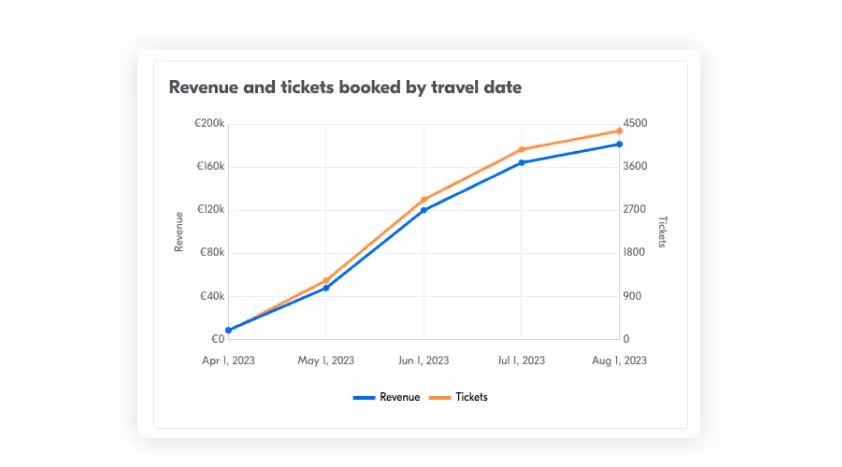
Other critical metrics, like tickets booked, are overlaid as well so you can identify correlations and potential causes for any upswings or dips.
But the real power lies in Analytics' ability to help you anticipate what's ahead.
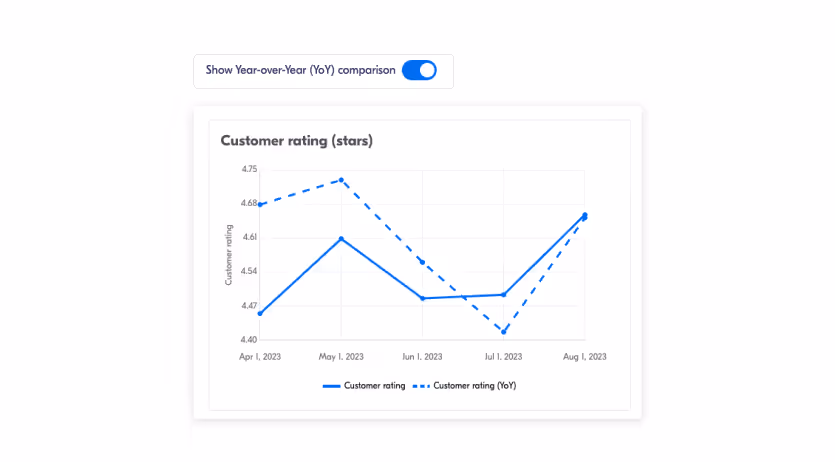
Let's say you introduced a new food tour last year, and you want to evaluate its performance compared to the previous year's offerings. With year-over-year comparison, you can quickly assess whether the new tour has contributed to increased revenue, bookings, or customer satisfaction.
This information can guide your decision-making process for introducing new tours or modifying existing ones.
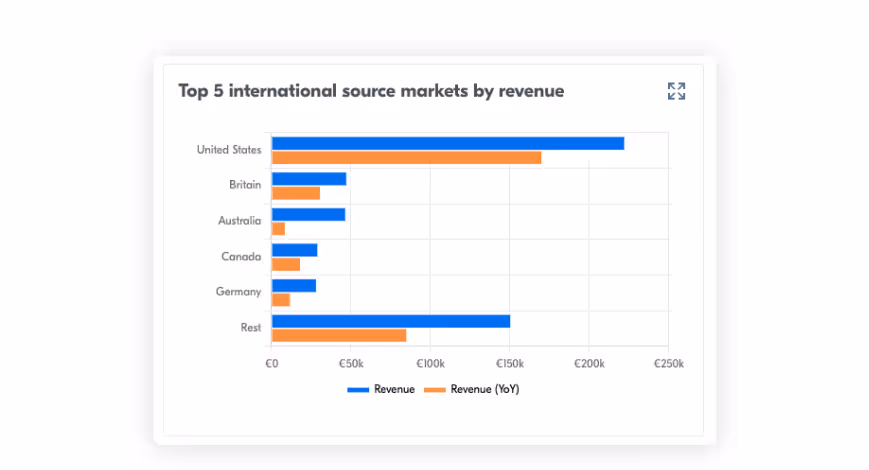
You can also use Analytics to identify where your customers come from. This highlights which countries are your biggest income drivers, allowing you to tailor your offerings and marketing to their preferences.
For example, let’s say you notice that travelers from the United States make up a significant portion of your revenue. Consider offering experiences that are popular with American tourists or ensure that your services cater to their expectations, such as guided tours in English or one that aligns with American cultural interests.
Another important way to understand your business performance is by monitoring your visitor and conversion rate.
Let’s first talk about visitors. This indicates how many people are seeing your tours on GetYourGuide.
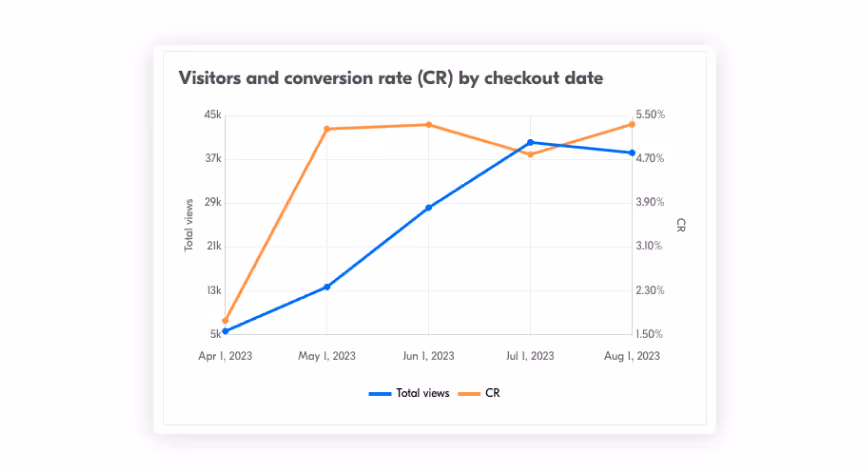
Conversion rate, on the other hand, gives you an indication of how many visitors make that booking.
Watch out: a high visitor count but low conversions could signal improvement for your offerings.
Pinpoint your star performers (and hidden opportunities)
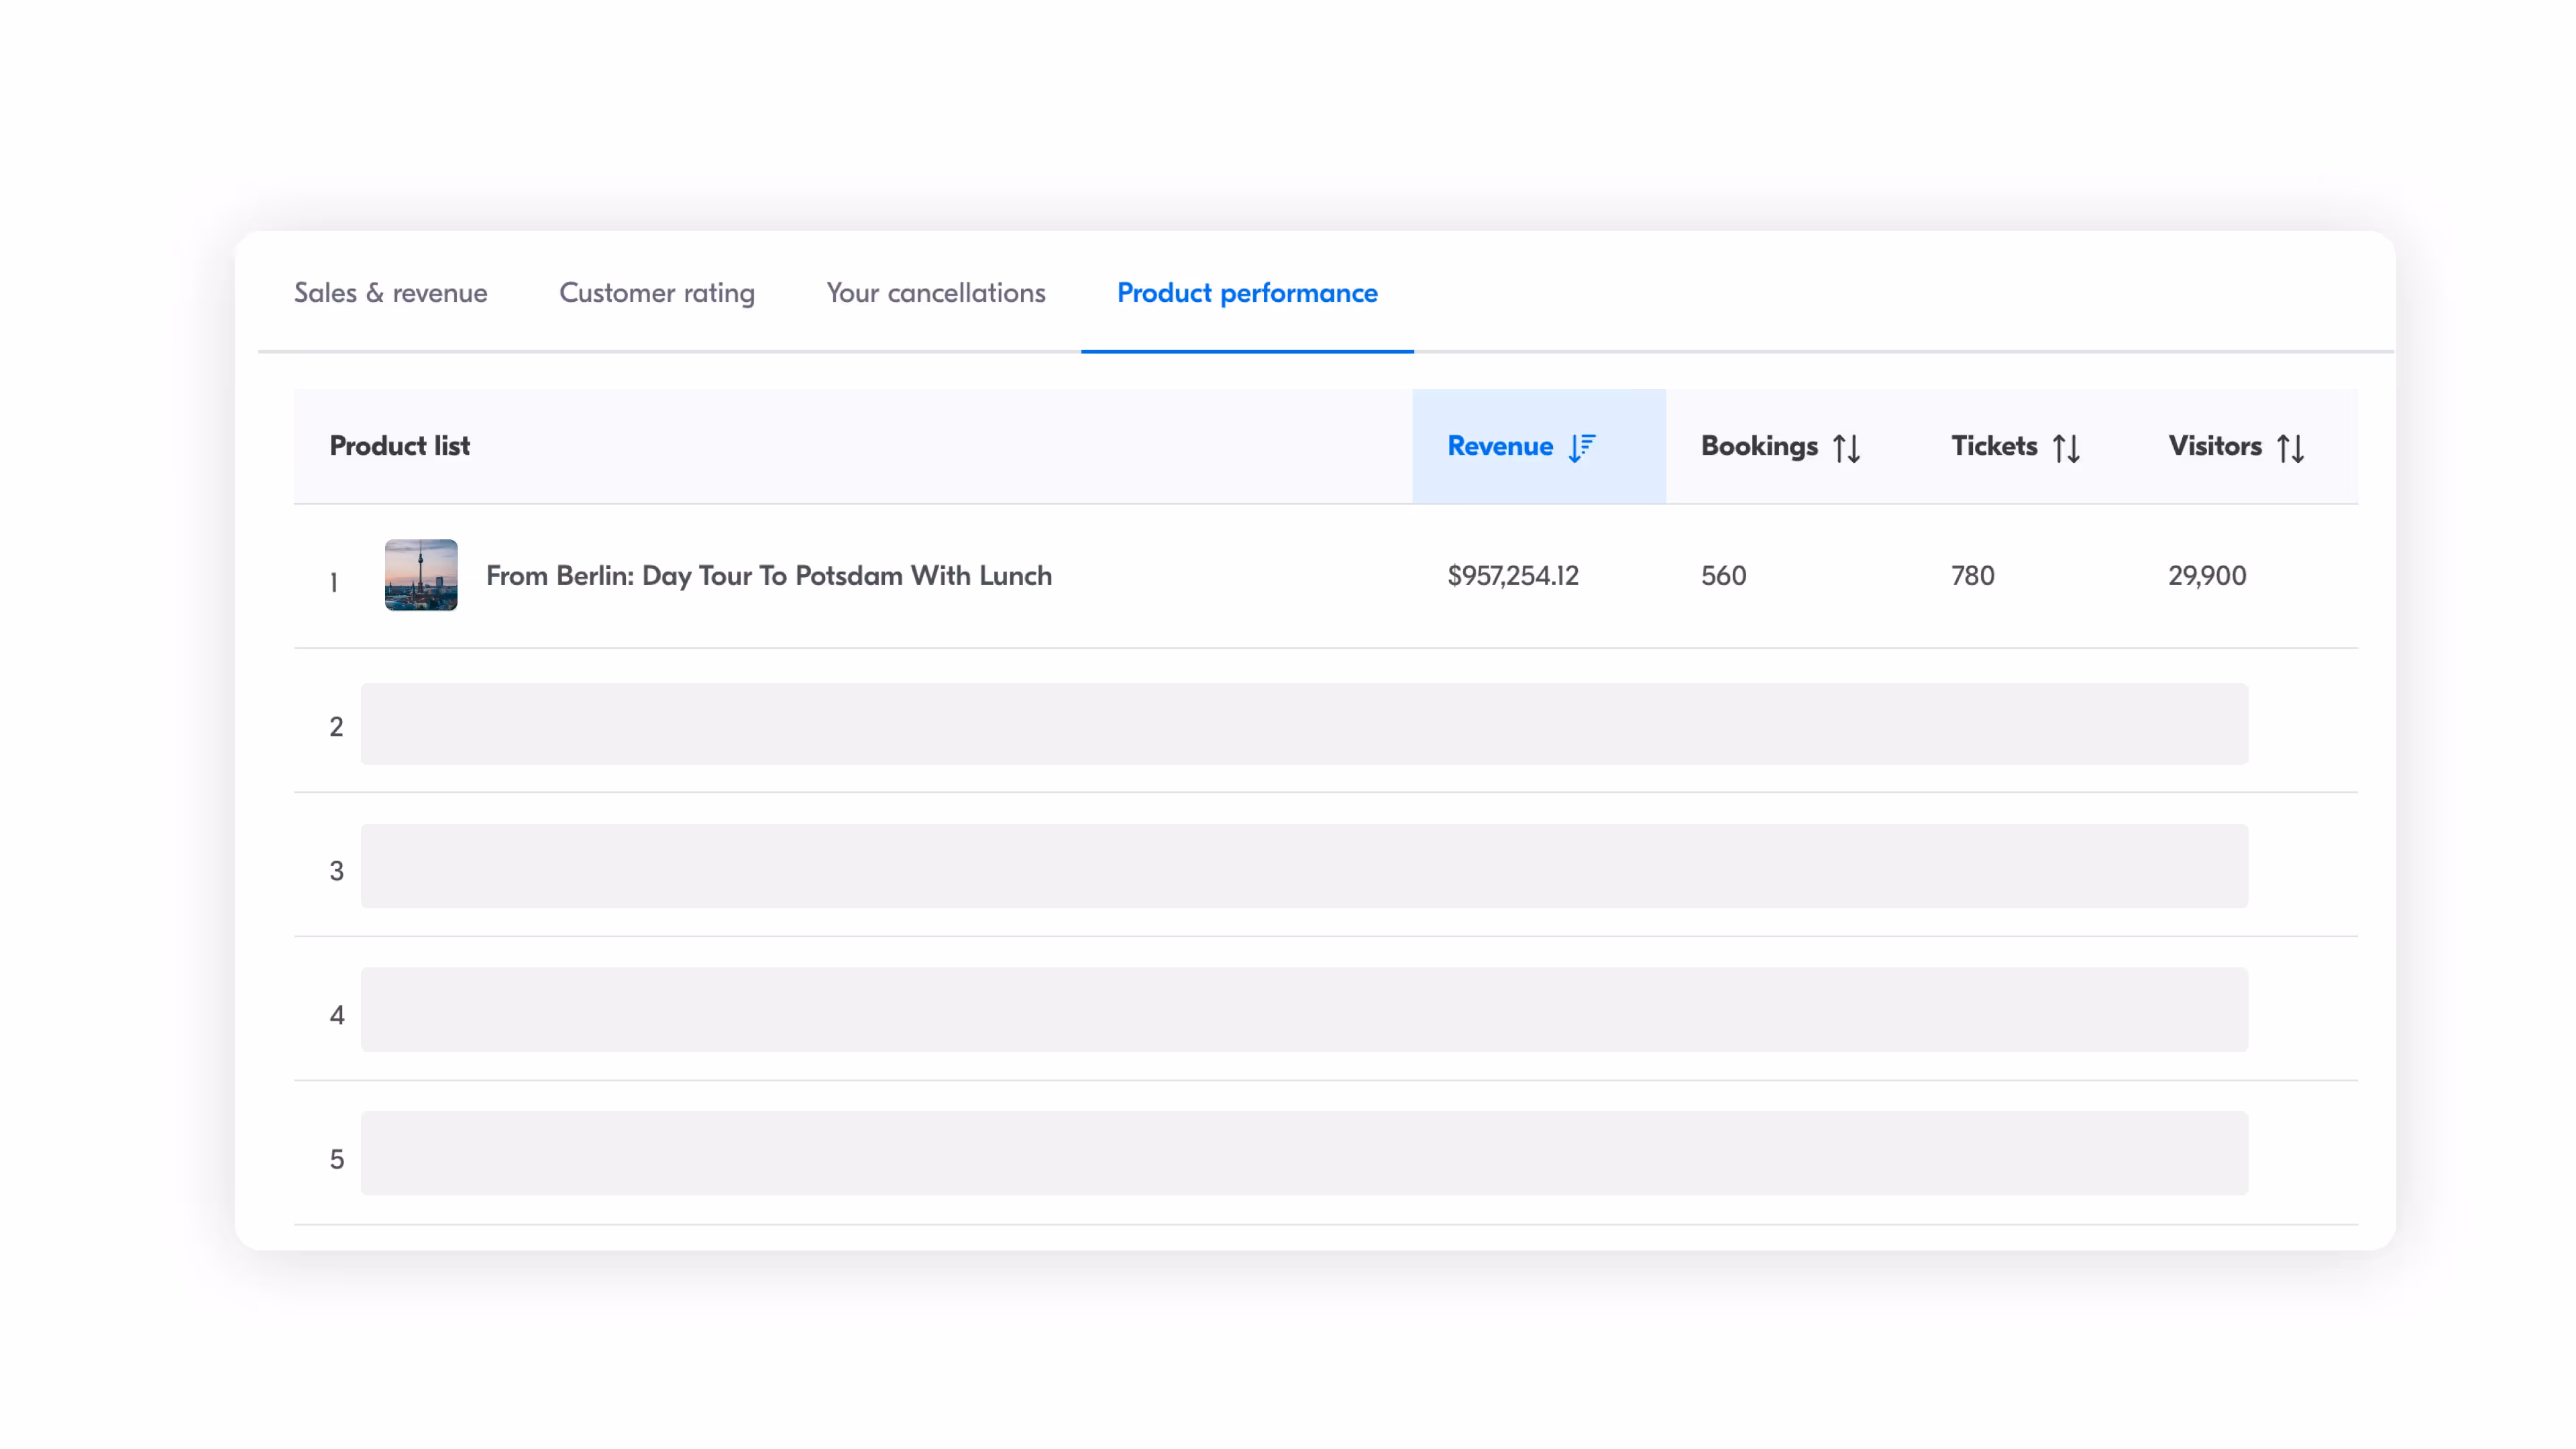
Not all products or services are equal in performance and profitability. While some may be runaway hits, others could stagnate or underperform. Without granular data, it’s almost impossible to identify those winners and losers.
This level of visibility makes it crystal clear which offerings are driving the bulk of your sales and fueling your bottom line.
But the true value comes from Analytics' ability to surface hidden opportunities within your underperforming products. For example, if you notice that one of your walking tours has an unusually low conversion rate compared to similar offerings, that could signal an issue with your pricing, content, or product that needs to be addressed.
On the flip side, if you see that a particular experience is receiving lackluster reviews despite steady bookings, you’ve just identified a prime opportunity to gather customer feedback and optimize that experience for better overall guest satisfaction.
Stay on top of customer happiness
As more and more people travel for experiences, delivering a world-class guest experience is non-negotiable. Why? Because happy customers lead to positive reviews, repeat bookings, and valuable word-of-mouth marketing for your business.
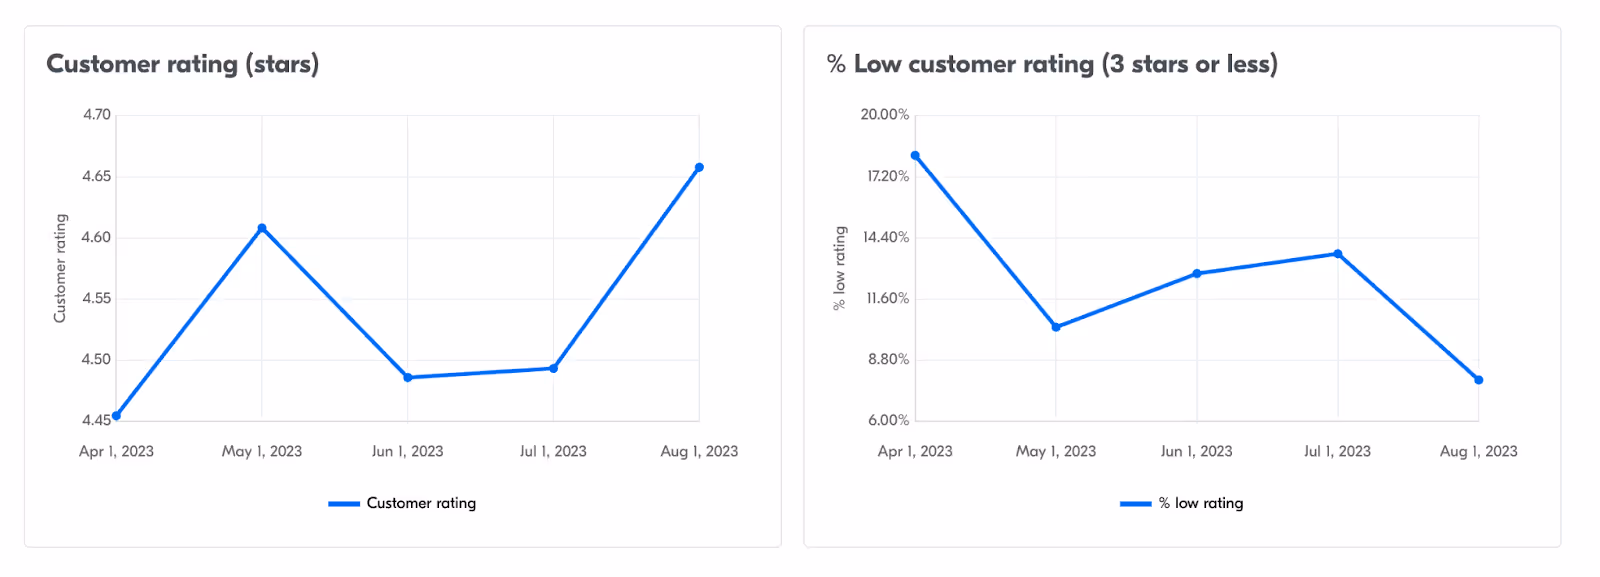
By monitoring customer ratings and cancellation rates, you can identify areas where your offerings may fall short and take proactive measures to enhance the customer experience.
In Analytics, you can see customer ratings and cancellation metrics like lost revenue, tickets canceled, and your overall cancellation rate (which represents the percentage of bookings you cancel). This will give you a trend so you can better adjust your offerings.
This way you can continuously optimize your offerings.
Get everyone on the same page
Data is just numbers until you can effectively communicate insights. That’s why you can easily download custom reports for your business and share them with your teams.
No more guesswork or assumptions—with objective performance data in hand, you and your team can align on a clear, evidence-based strategy. Maybe the numbers show your conversion rates have been steadily declining, suggesting your marketing needs a revamp. Or perhaps you identify an emerging source market that represents an untapped growth opportunity.
Whatever challenges or opportunities arise, Analytics can help ensure your entire team is working from a single source of truth so you can drive alignment, facilitate more informed discussions, and accelerate decision-making cycles.
Try out Analytics
These are just a few of the ways GetYourGuide's powerful new Analytics dashboard can completely transform how you track your success, analyze performance, and optimize your products for growth on GetYourGuide.
With GetYourGuide Analytics, you can easily view key metrics like revenue, bookings, conversion rates, and customer ratings for your products and experiences.
Get started.
Connect with travelers looking for exactly the kind of experience you offer by signing up today.


